Well, shut the front door, please! Just for grins I started running some of my desultory benchmarks and speed tests on the Dell Micro 7080 I just bought to replace the old mini-ITX box. When you see the numbers and screencaps I’ll be sharing in the following ‘graphs, you’ll understand why my title for this item is “Dell 7080 Micro Performance Amazes.”
Why say: Dell 7080 Micro Performance Amazes?
The numbers do not lie. They’re all pretty incredible, too. Here are some start/boot numbers, with the 7080 left and the (much more expensive) P-5550 numbers right:
| Description | Action | 7080 Micro | P-5550 |
|---|---|---|---|
| Desktop to machine off | Shutdown | 7.92 sec | 13.02 sec |
| Turned off to desktop | Cold boot | 10.46 sec | 16.01 sec |
| Desktop to desktop | Restart | 21.26 sec | 30.01 sec |
Across the board, then, the $1,200 7080 Micro is significantly faster than the $4K-plus Precision 5550 Workstation. Of course, this takes no account of the more expensive unit’s Radeon Pro GPU. The 7080 Micro simply relies on its built-in Intel UHD Graphics 630 circuitry to render bits on its Dell 2717D UltraSharp monitor, and does so reasonably well. But this comparison is unfair to the P-5550 because UHD 630 is not like a dedicated GPU, especially a professional-grade one like the P-5550’s Nvidia Quadro T2000.
But Wait, There’s More…
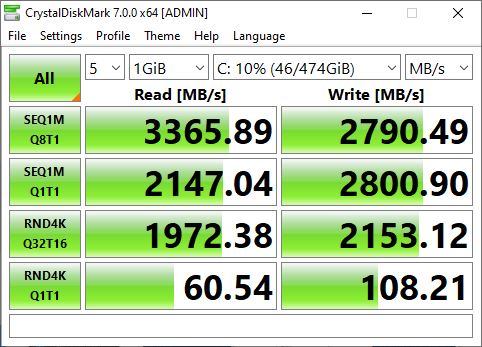
The CrystalDiskMark results are also mostly faster than those from the P-5550. The lead-in screenshot shows the 7080 Micro’s CDM results. Compare those for the P-5550 and you get the following, where I’ve bolded the best times in each category so you can see that the 7080 Micro beats the P-5550 in 6 out of 8 categories.
| CDM Label | Action | 7080 Micro | P-5550 |
|---|---|---|---|
| SEQ1M/Q8T1 | Read | 3364.8 | 3373.64 |
| Write | 2790.49 | 2334.67 | |
| SEQ1M/Q1T1 | Read | 2147.04 | 1716.39 |
| Write | 2800.90 | 2056.88 | |
| RND4K/Q32T16 | Read | 1972.38 | 630.64 |
| Write | 2152.12 | 358.26 | |
| RND4K/Q1T1 | Read | 60.54 | 41.21 |
| Write | 108.21 | 119.34 |
I’m particularly impressed with the 4K Random write numbers with queue depth of 32 and thread count of 16, at which the 7080 Micro kills the P-5550 (read is more than 3 times faster; write is more than 6 times faster). With a queue depth and thread counts of 1 each, it’s a split decision: the 7080 Micro is almost 50% faster at reads, and the P-5550 is about 10% faster at writes. Even when the P-5550 comes out ahead it’s by less than 10% in both cases. To me, that puts the 7080 Micro way, way ahead of the P-5550, especially considering the price differential.
Am I happy with my 7080 Micro purchase? So far, heck yes! More to come as I have more time to do benchmarking. This week is jammed up, but maybe Thanksgiving week I’ll find more time. Stay tuned.