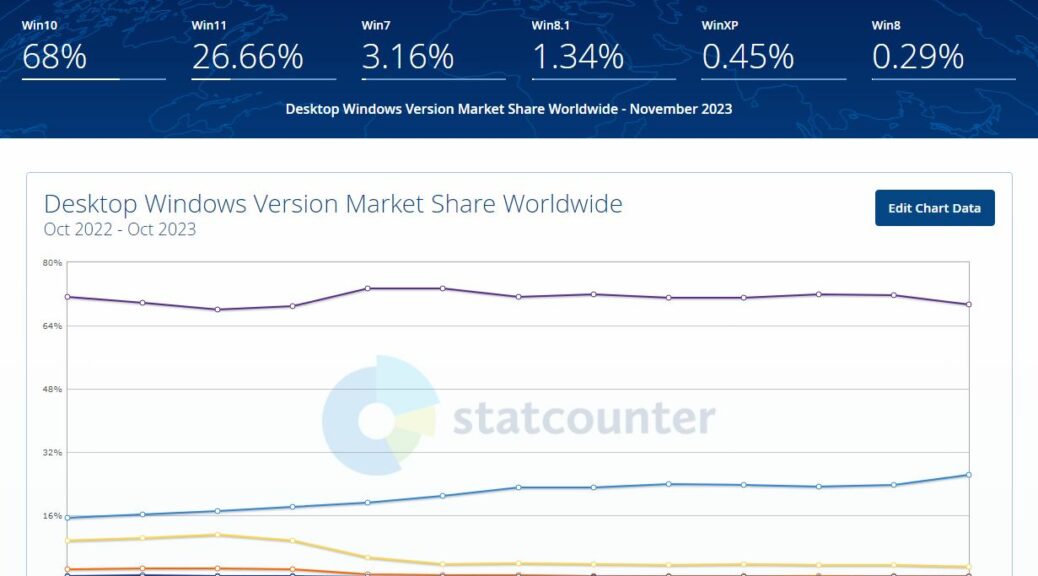
Well, well, well. Here’s an interesting Windows statistic for you. According to StatCounter, the global desktop OS marketshare for Windows 11 hit 26.17% at the end of October. That’s up by 2.53% from the previous month. And it’s the first time Windows 11 shows running on over 1 in every 4 PCs using the Internet. You can see some related numbers in the lead-in screencap. Indeed, it claims Windows 11 marketshare jumps quarter mark vis-a-vis other versions.
What Windows 11 MarketShare Jumps Quarter Mark Means
I have some questions about the Statcounter image and numbers (see lead-in graphic), though. Across the top bar of the image you see Windows 10 at 68%, and 11 share at 26.66% and so forth. But if I mouseover the data points at the end of those counter lines, they report 69.31% for Windows 10 and 26.17% for 11. I don’t understand why there’s a discrepancy, but I’m taking the numbers from the charts rather than the top line stuff as “correct.”
By way of comparison, I also checked analytics.usa.gov which keeps track of devices visiting US government websites (“5.33 billion sessions over the past 90 days,” so an appreciable data volume from which to draw statistics and inferences). It doesn’t report Windows 11 numbers per se. (I believe they’re included in its Windows 10 count because Windows 11 still uses a Windows 10 user agent ID in web browsers.) But it shows 98.37% of Windows visitors were running one or the other of those two OSes. (Add the 2 Statcounter numbers together and you get 95.48% — not horribly divergent.)
Alas, Copilot still quotes old Statista numbers (the company requires an annual subscription that costs US$1,788 for free, unfettered access to their latest stats). Thus, I can’t use them as an additional point of reference.
Looking at the Trend Lines
Whereas the Windows 11 line in the Statcounter chart is definitely trending upward, you can’t really say the Windows 10 line is visibly trending downward. It’s sort of meandering, with both ups and downs in the 12-month period on display there.
The 2.53% September-to-October jump for Windows 11 is pretty interesting, though. That’s a 10.7% jump in a single month, which is massive. It’s significantly higher than preceding month-to-month changes. All of those are positive in slope, but none comes close to even half that value.
Recently, I’ve commented that business hasn’t yet gotten serious about migrating from Windows 10 to 11. This spike could be evidence that my comment is based on outdated tracking and stats. We’ll get a much better idea if things are truly picking up, or if this is a short-lived spike, as data for the next few months gets reported.
This has, however, piqued my interest pretty sharply. Stay tuned and I’ll let you know which way the worm turns next. It could be that the tide is finally turning… The numbers may not lie, exactly, but they don’t always slap us in the face with what’s going on, either.
Is a Leapfrog Release Coming? (Added Dec 4)
Fascinating follow-up from a Martin Brinkmann story over at Ghacks this morning. It’s entitled Windows 11 24H2 and Windows 12 Expected in 2024. It puts forward two fairly credible sources for info that MS may ship an entirely new Windows version next year. This would put “Windows 12” (stalking horse name, since MS is of course mum on this topic) out before Windows 10 goes EOL. That would indicate a jump from 10 to 12 would be in the offing, leapfrogging over 11 entirely. Now there’s a twist I didn’t see coming. This should be fun to watch.