I can’t help it. I still love Windows Gadgets. They came in — and went out — with Windows 7, supposedly because of security considerations. I’ve never had, nor heard of such issues in the wild. My old friend and security guru, Deb Shinder, also uses Gadgets. She feels the same away about their demise. Helmut Buhler created 8GadgetPack to bring Gadgets to Windows 8. He’s kept up with them, and they work well with Windows 10. (His current version is v29.0, released in May 2019, so it’s pretty up-to-date.) Each time you upgrade Windows, it sees Gadgets and kills them off. So he’s also written a “Restore Gadgets” routine that recognizes this act, and restores the pre-existing Gadget set-up after each OS-based cancellation. Lately, though, I’ve been posed an interesting Win10 Gadget conundrum.
What’s the Condundrum?
The two following screenshots show the puzzler I’ve been dealing with lately. Notice the display at the bottom of the two CPU Meter Gadget windows that follow. It’s a CPU utilization graph, that shows per-core utilization percentages. The graph on the left-hand-side fills up the entire Gadget panel, while the one on the right-hand-side fills up only about two-thirds. After the most recent Nvidia driver update (which applies to the left-hand item) the Gadget on that PC went from a partial graph area (which applies to the right-hand item) to the full graph area. The PC from which the right-hand item comes is a Surface Pro 3 that uses built-in Intel graphics circuitry that’s built into the i7-4650U processor in that machine. The PC on the left is my production desktop, as the i7-6700 CPU should indicate.
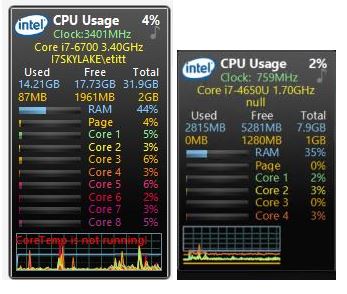
Careful inspection shows the utliization graph at the left fills the full Gadget frame, while the one on the right fills about two-thirds of the same area. What gives?
Here’s the conundrum: I’m pretty sure that there’s something in the nexus between .NET and the GPU driver that’s causing the CPU utilization display area issue. Installing Nvidia’s latest GeForce driver (Version 431.60, which shows a 7/23/2019 release date (but which I just installed today, 8/5/2019) on my production PC fixed the issue. It still persists on all of my systems running Intel on-chip GPUs.
A Minor Niggle Still in Search of a Fix
This is the kind of mystery that guarantees lifetime (or at least ongoing) employment for Windows wizards, gurus, and mavens. I’ll keep messing around with those Intel drivers until I find one that works like it’s supposed to. This has been going on at least since last February or thereabouts, though, so Intel’s obviously under no pressure to catch up with this minor and niggling little GUI detail. It gives me something to do when I get bored, so I can’t complain. And so it goes, here in Windows-World!
PostScript Added August 6, 2019
OK, so I updated my Lenovo T520’s graphics driver last night, too. It includes both an Intel on-chip GPU (HD 3000) and an Nvidia Quadro NVS4200M independent GPU. I updated the Nvidia device to Version 392.56 later yesterday afternoon. This machine had also been subject to the “reduced display” layout shown above for the Surface Pro 3. But after I remoted into that machine this morning, I immediately noticed that the CPU utilization graph at the bottom of the gadget now filled the entire pane, to wit:
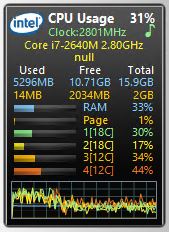
This time I loaded Core Temp so that the “not running” error message didn’t appear. Makes the utilization graph a little easier to see and appreciate. So somehow, updating the Nvidia driver (even though I’m not using it) fixed the problem. As a consequence, I’m rethinking my theory of what’s causing the problem. But on my Intel-only systems, the problem persists. I’ll keep working on it . . .